
Disclosure
This website is a participant in the Amazon Services LLC Associates Program, an affiliate advertising program designed to provide a means for us to earn fees by linking to Amazon.com and affiliated sites.
Did you know a fully charged 12V flooded lead-acid battery should read 12.6–12.8V at rest, but most people mistake 12.4V as “healthy”? Voltage is the lifeline of your battery, and misinterpreting it can lead to premature failure or unexpected power loss.
Whether you’re maintaining a car battery, solar storage, or a backup power system, understanding voltage readings is non-negotiable for longevity and performance. Many assume a battery is “good” if it starts their engine, but voltage reveals hidden problems like sulfation or undercharging.
Best Tools for Monitoring Flooded Lead-Acid 12V Battery Voltage
Fluke 115 Digital Multimeter
For precise voltage readings, the Fluke 115 is a top-tier choice. Its True RMS accuracy ensures reliable measurements, while the rugged design withstands tough environments. The large backlit display makes readings easy, and its auto-ranging feature eliminates guesswork—perfect for checking battery health under load or at rest.
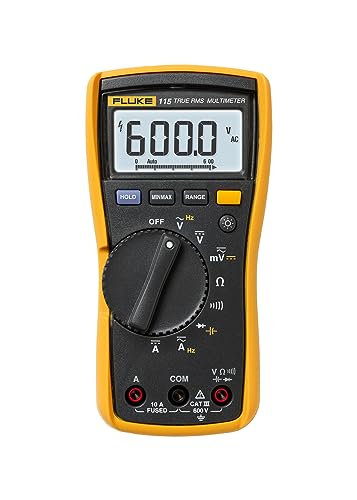
- Compact True-rms digital multimeter for field technicians
- Measures True-rms voltage and current with plus resistance, continuity,…
- Min/Max/Average to record signal fluctuations
NOCO Genius G3500 Battery Charger & Maintainer
The NOCO Genius G3500 is ideal for maintaining flooded lead-acid batteries. Its advanced diagnostics detect sulfation and automatically apply repair modes. With a 3.5A output, it efficiently charges and maintains 12V batteries, extending lifespan through intelligent voltage regulation and temperature compensation.

- MEET THE GENIUS5 — Similar to our G3500, just better. It’s 34% smaller…
- DO MORE WITH GENIUS — Designed for 6-volt and 12-volt lead-acid (AGM,…
- ENJOY PRECISION CHARGING — An integrated thermal sensor dynamically…
Victron Energy BMV-712 Battery Monitor
For deep-cycle applications, the Victron Energy BMV-712 offers Bluetooth monitoring, tracking voltage, state of charge, and historical data. Its high-precision shunt ensures accurate readings, while customizable alarms alert you to under/over-voltage conditions—essential for solar or marine battery systems.

- COMPREHENSIVE BATTERY MONITORING: The Victron Energy BMV-712 Smart Battery…
- ADDITIONAL INPUT: Victron Energy BMV-712 features an additional input which…
- BUILT-IN BLUETOOTH COMMUNICATION: Wirelessly monitor your batteries on…
12V Flooded Lead-Acid Battery Voltage States
A flooded lead-acid battery’s voltage directly reflects its charge level and health, but interpreting readings correctly requires understanding different operational states. Unlike sealed batteries, flooded types need regular maintenance, and voltage checks are your first diagnostic tool. Here’s what each voltage range means and why it matters.
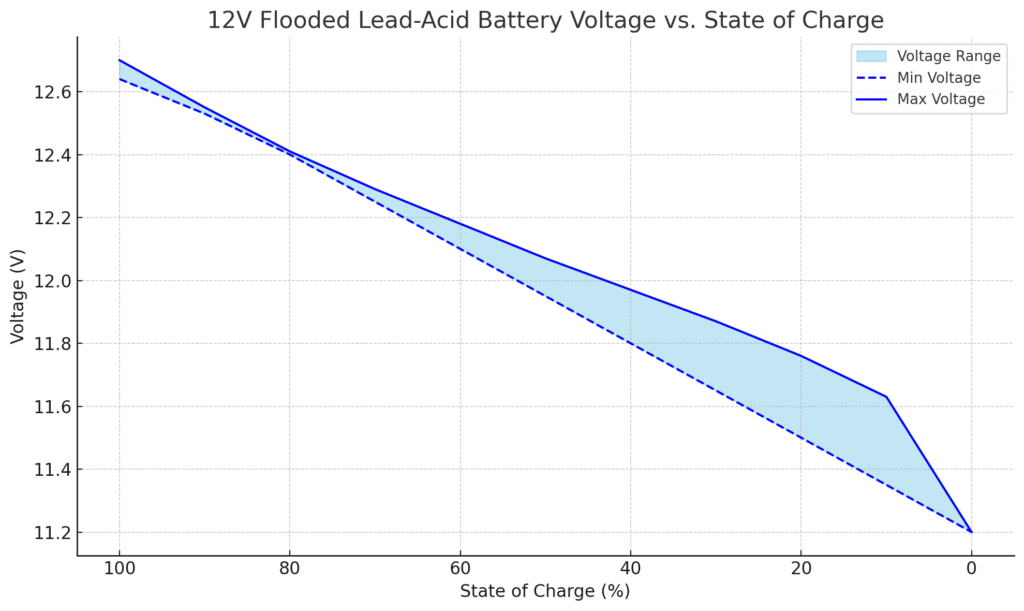
12V Flooded Lead-Acid Battery Voltage vs. State of Charge
| State of Charge (%) | Voltage (V) |
|---|---|
| 100% | 12.64 – 12.70 |
| 90% | 12.53 – 12.55 |
| 80% | 12.41 – 12.40 |
| 70% | 12.29 – 12.25 |
| 60% | 12.18 – 12.10 |
| 50% | 12.07 – 11.95 |
| 40% | 11.97 – 11.80 |
| 30% | 11.87 – 11.65 |
| 20% | 11.76 – 11.50 |
| 10% | 11.63 – 11.35 |
| 0% (empty) | 11.20 or lower |
Resting Voltage vs. Under-Load Voltage
Resting voltage (measured after 2+ hours without charging/discharging) gives the most accurate state-of-charge reading. A fully charged 12V battery should read 12.6–12.8V. At 12.4V, it’s only 75% charged, and below 12.0V indicates severe discharge risking sulfation damage.
Under-load voltage drops temporarily during use. For example:
- Starting a car: Healthy batteries briefly dip to 9.6–10.5V but recover to ~12.4V immediately after
- Running lights/accessories: Expect 11.8–12.3V; sustained readings below 11.6V suggest weak cells
Temperature’s Impact on Voltage Readings
Voltage fluctuates with temperature—a critical detail often overlooked. For every 10°F (5.5°C) change:
- Cold (32°F/0°C): Voltage reads 0.2V lower than actual charge
- Hot (95°F/35°C): Voltage reads 0.2V higher, masking undercharge
Always compensate by adding/subtracting 0.002V per °F from your reading.
Charging Voltage Benchmarks
During charging, voltages rise above resting levels:
- Bulk stage: 14.4–14.8V (high current fills battery rapidly)
- Absorption stage: 13.8–14.2V (prevents gassing while topping off)
- Float stage: 13.2–13.4V (maintains charge without overcharging)
Exceeding 15V causes dangerous electrolyte loss, while under 13.8V fails to fully charge.
Pro Tip: Test voltage at the terminals, not through corroded cables. A 0.3V drop across connections falsely indicates a dead battery when the issue is just resistance.
How to Properly Test Your 12V Flooded Lead-Acid Battery Voltage
Accurate voltage testing is crucial for battery maintenance, but most people make critical mistakes that lead to false readings. Follow this professional testing protocol to get reliable results and diagnose real issues.
Step-by-Step Voltage Testing Procedure
1. Preparation (Critical for Safety)
- Park on level ground and turn off all loads (lights, radio, accessories)
- Wait 2+ hours after charging/discharging for resting voltage accuracy
- Wear protective gloves and eyewear – electrolyte is corrosive
2. Terminal Connection Technique
- Clean terminals with baking soda/water solution to remove corrosion
- Use the multimeter’s needle probes to penetrate oxide layers for metal-to-metal contact
- Connect red probe to positive (+) terminal first, then black to negative (-)
Interpreting Results: Beyond Basic Voltage Numbers
A 12.2V reading might seem acceptable, but context matters:
- New battery: Indicates 50% discharge – needs immediate charging
- 3-year-old battery: Could signal sulfation even after full charge
- After overnight charge: Suggests faulty alternator or charger
Load Testing for Hidden Weaknesses
- Record resting voltage (e.g., 12.6V)
- Apply 50% CCA load for 15 seconds (use headlights or load tester)
- Healthy batteries maintain >9.6V during load and recover to within 0.2V of original
Failure indicates internal damage even if voltage seems normal at rest.
When to Suspect Specific Issues
Voltage drops rapidly after charging: Likely sulfation buildup on plates. Try equalization charge at 15V for 2-4 hours (only for flooded batteries).
One cell significantly lower: Use a hydrometer to check specific gravity differences >0.050 between cells indicates failure.
Professional Tip: Always test voltage before and after charging. A battery that won’t exceed 12.8V after 8 hours of charging has likely reached end-of-life.
Advanced Voltage Analysis: Diagnosing Battery Health and Performance Issues
Beyond basic voltage readings, sophisticated analysis can reveal hidden battery problems and predict remaining lifespan. This section explores professional-grade diagnostic techniques used by battery specialists.
Voltage Recovery Patterns and Their Meaning
How a battery’s voltage responds after discharge tells more about its condition than static measurements:
| Recovery Pattern | Time to Stabilize | Diagnosis |
|---|---|---|
| Quick recovery (within 5 min) | Returns to within 0.1V of pre-load voltage | Healthy battery with good plate condition |
| Slow recovery (30+ min) | Stabilizes 0.3-0.5V below original | Early sulfation or electrolyte stratification |
| No recovery | Remains at load voltage | Severe sulfation or physical plate damage |
Voltage Differential Analysis Between Cells
Measuring individual cell voltages (2V per cell in 12V battery) reveals imbalances:
- Normal variation: ≤0.05V difference between cells
- Moderate imbalance: 0.05-0.15V difference indicates developing stratification
- Severe imbalance: >0.15V suggests shorted plates or contamination
Example: A battery showing 2.1V, 2.1V, 1.8V, 2.0V, 2.1V, 2.1V has one weak cell likely causing overall performance issues.
Temperature-Compensated Voltage Evaluation
Professional analysis accounts for temperature effects using these adjustments:
- For every 10°F below 77°F (25°C), add 0.028V to reading
- For every 10°F above, subtract 0.028V
- At 32°F (0°C), a “fully charged” 12.6V reading actually indicates 104% charge
This explains why batteries seem weaker in winter – the voltage doesn’t reflect actual available power.
Cyclic vs. Float Service Voltage Profiles
Application-specific voltage requirements:
Deep cycle (solar/RV):
- Charge to 14.8V for complete absorption
- Allow periodic equalization charges at 15.5V
- Never discharge below 12.1V (50% DoD)
Starter batteries:
- Maintain 13.2-13.4V float voltage
- Limit discharges to 12.4V (20% DoD)
- Avoid equalization charges
Critical mistake: Using automotive charging profiles for deep-cycle applications accelerates plate corrosion by 300%.
Voltage-Based Maintenance Strategies for Flooded Lead-Acid Batteries
Proper voltage monitoring enables proactive maintenance that can double your battery’s lifespan. This section reveals professional maintenance protocols based on voltage characteristics and their scientific basis.
Voltage-Guided Charging Techniques
Different voltage thresholds trigger specific charging actions:
- 12.4V (75% charge): Initiate charging immediately to prevent sulfation nucleation
- 14.4V (absorption phase): Maintain for 4 hours minimum to ensure complete conversion of lead sulfate
- 13.2V (float maintenance): Reduce to this level after absorption to prevent gassing while maintaining charge
Advanced technique: For batteries showing voltage depression (consistently low readings), perform an equalization charge at 15.5V for 2-3 hours until specific gravity stabilizes across all cells.
Voltage-Based Watering Schedule
Electrolyte levels directly affect voltage readings and require different maintenance at various charge states:
| Voltage Range | Watering Protocol | Reasoning |
|---|---|---|
| Below 12.4V | Charge before watering | Prevents electrolyte overflow during subsequent charging |
| 12.6-12.8V | Water to 1/8″ above plates | Optimal level for gas recombination without spillage |
| Above 14.4V | Never add water | Risk of electrolyte eruption from gassing |
Voltage Monitoring for Seasonal Storage
Proper storage voltages vary by temperature and duration:
- Short-term (1-3 months): Maintain at 12.8V with monthly topping charge
- Winter storage (below freezing): Store at 13.2V to prevent electrolyte freezing
- Long-term (6+ months): Equalize to 15V, then disconnect and store at 12.2V
Critical mistake: Storing at 12.0V or below causes permanent sulfation damage within weeks.
Voltage Thresholds for Battery Replacement
When voltage patterns indicate end-of-life:
- Fails to reach 12.6V after 24-hour rest post-charging
- Voltage drops >0.5V during 15-second load test
- Cell voltage variance >0.3V persists after equalization
- Requires watering more than monthly under normal use
These symptoms typically appear when the battery has lost 40% of its original capacity.
Long-Term Performance Optimization and Future Trends in Flooded Lead-Acid Technology
Maximizing the value of flooded lead-acid batteries requires understanding their evolving role in modern energy systems and implementing cutting-edge maintenance approaches. This section explores advanced optimization strategies and emerging developments.
Voltage-Centric Life Extension Techniques
Advanced users can implement these voltage management strategies to extend battery life beyond typical expectations:
| Technique | Voltage Parameters | Expected Life Extension |
|---|---|---|
| Pulsed Equalization | 15.2V pulses (2hrs/month) | 30-40% longer cycle life |
| Temperature-Compensated Charging | ±0.003V/°F from 77°F baseline | 25% reduction in water loss |
| Partial State-of-Charge Cycling | Maintain 12.2-12.4V daily range | 2-3× more cycles than deep cycling |
Implementation note: These techniques require specialized chargers with microprocessor control.
Economic Analysis of Voltage Monitoring
A comprehensive cost-benefit assessment reveals:
- Monitoring equipment cost: $50-200 for quality multimeters/monitors
- Savings potential: Extends $150 battery life from 3 to 5 years ($90 savings per battery)
- Downtime prevention: Avoids $300+ emergency replacement costs
- Energy efficiency: Proper charging saves 15-20% in electricity costs
The ROI typically exceeds 300% for systems with multiple batteries.
Environmental and Safety Considerations
Voltage management directly impacts environmental and safety outcomes:
- Overcharging prevention (above 14.8V) reduces hazardous gassing by 80%
- Proper equalization decreases lead contamination risk from sulfation
- Voltage-based watering minimizes electrolyte waste and spillage
- End-of-life voltage thresholds ensure timely recycling before catastrophic failure
Emerging Technologies and Future Outlook
While flooded lead-acid batteries face competition from new technologies, voltage monitoring innovations are extending their relevance:
- IoT-enabled voltage sensors provide real-time cloud monitoring
- AI-powered predictive analytics use voltage patterns to forecast failures
- Advanced plate alloys maintain more stable voltage under load
- Hybrid systems combine lead-acid with supercapacitors for voltage stabilization
Industry projection: Flooded lead-acid will remain dominant in industrial applications through 2030 due to its voltage stability and recyclability advantages.
System Integration and Advanced Voltage Management Techniques
Modern applications demand sophisticated voltage management approaches that integrate flooded lead-acid batteries with other system components. This section explores professional integration strategies and their impact on overall system performance.
Multi-Bank Voltage Balancing Strategies
When connecting multiple batteries in series or parallel, voltage management becomes critical:
- Parallel configuration: Maintain ≤0.1V difference between banks to prevent circulating currents
- Series configuration: Implement individual cell voltage monitoring (ICVM) to detect weak links
- Mixed voltage systems: Use DC-DC converters when integrating 12V with 24/48V systems
Real-world example: Solar installations often combine four 12V batteries in series-parallel – voltage imbalances here can reduce system efficiency by up to 40%.
Voltage Compensation for Cable Losses
Professional installations account for voltage drops across wiring:
| Wire Gauge (AWG) | Voltage Drop per 10ft @ 20A | Compensation Required |
|---|---|---|
| 4 | 0.025V | Minimal |
| 8 | 0.064V | Increase charge voltage by 0.1V |
| 12 | 0.161V | Requires wiring upgrade |
Always measure voltage at battery terminals, not at distant equipment connections.
Advanced Charging System Integration
Modern charging systems use voltage data for intelligent management:
- Smart alternators: Adjust output voltage (13.2-15V) based on battery state
- Solar charge controllers: Utilize voltage-based MPPT algorithms
- Industrial chargers: Implement voltage-tapered charging curves
Pro tip: Program voltage setpoints 0.2V higher for systems with long cable runs or multiple connection points.
Troubleshooting Complex Voltage Issues
Diagnose these common integration problems through voltage analysis:
- Voltage “walkaway”: Increasing differences between parallel batteries indicate connection corrosion
- Load-induced oscillations: Rapid ±0.5V fluctuations suggest undersized wiring
- Charge acceptance failure: Voltage rising too quickly during charging reveals sulfation
Always verify voltage at multiple system points when diagnosing integration issues.
Professional-Grade Voltage Management Systems and Quality Assurance Protocols
For mission-critical applications, advanced voltage monitoring systems and rigorous validation procedures ensure maximum flooded lead-acid battery performance and reliability. This section details industrial-grade solutions and their implementation.
Enterprise-Level Voltage Monitoring Architectures
Large-scale installations require sophisticated monitoring approaches:
| System Type | Voltage Precision | Key Features | Typical Applications |
|---|---|---|---|
| Distributed Shunt Monitoring | ±0.01V accuracy | Individual cell tracking, historical trending | Telecom backup, data centers |
| Wireless Mesh Networks | ±0.02V accuracy | Self-configuring nodes, cloud integration | Renewable energy farms |
| AI Predictive Systems | ±0.005V accuracy | Failure forecasting, adaptive charging | Industrial UPS systems |
Voltage Validation and Calibration Procedures
Maintain measurement accuracy with these professional protocols:
- Quarterly calibration: Verify monitoring equipment against NIST-traceable references
- Three-point validation: Check at 10V, 12V, and 15V ranges
- Temperature compensation: Validate at 32°F, 77°F, and 104°F (0°C, 25°C, 40°C)
- Load testing correlation: Confirm voltage drop predictions match actual performance
Risk Mitigation Through Voltage Analysis
Advanced voltage pattern recognition prevents system failures:
- Early sulfation detection: 0.1V higher than expected resting voltage
- Plate corrosion indicators: Gradual charge voltage increase over months
- Thermal runaway precursors: Unexplained voltage drops during charging
- Connection failure signs: Increasing voltage differentials between identical banks
Performance Optimization Framework
Implement this voltage-based optimization cycle:
1. Baseline Establishment
- Document new battery voltage profiles at various loads
- Create temperature compensation curves
2. Continuous Monitoring
- Track voltage recovery rates after discharges
- Monitor charging voltage acceptance curves
3. Adaptive Adjustment
- Modify charge voltages based on historical patterns
- Adjust equalization frequency per voltage trends
Industrial case study: A cellular tower operator extended battery life from 3 to 7 years by implementing this framework with 0.5% voltage monitoring precision.
Conclusion: Mastering Flooded Lead-Acid Battery Voltage for Optimal Performance
Throughout this comprehensive guide, we’ve explored the critical relationship between voltage readings and flooded lead-acid battery health – from fundamental voltage benchmarks to advanced diagnostic techniques.
You’ve learned how to interpret resting versus loaded voltages, implement temperature compensation, conduct professional load testing, and integrate sophisticated monitoring systems. Most importantly, you now understand that voltage isn’t just a number, but a window into your battery’s condition and remaining lifespan.
Take action today: Begin applying these voltage monitoring techniques to extend your batteries’ service life, prevent unexpected failures, and maximize their performance. Whether you’re maintaining a single automotive battery or managing an industrial bank, consistent voltage analysis will pay dividends in reliability and cost savings. Keep this voltage chart as your essential reference, and remember – in battery maintenance, voltage tells the whole story.
Frequently Asked Questions About Flooded Lead-Acid 12V Battery Voltage
What voltage indicates a fully charged 12V flooded lead-acid battery?
A fully charged 12V flooded lead-acid battery at rest (2+ hours after charging) should read between 12.6V and 12.8V at 77°F (25°C). When charging, the voltage rises to 14.4-14.8V during bulk charging, then settles to 13.8-14.2V during absorption. These values decrease by 0.028V for every 10°F above 77°F and increase by the same amount below this temperature.
How often should I check my battery’s voltage?
For regular maintenance, check voltage monthly. In demanding applications (solar systems, marine use), check weekly. Always test before and after charging, and after any deep discharge.
More frequent monitoring (daily) is recommended when troubleshooting issues or when batteries are near end-of-life. Combine voltage checks with specific gravity tests for flooded batteries every 3-6 months.
Why does my battery show 12.4V but won’t start my car?
12.4V indicates only 75% charge – insufficient for reliable starting. More critically, this voltage might mask internal damage. The battery could have high internal resistance from sulfation, causing voltage to collapse under load. Test by measuring voltage while cranking – if it drops below 9.6V, the battery is failing despite showing adequate resting voltage.
Can I use the same voltage chart for AGM and flooded batteries?
No. AGM batteries have different voltage characteristics: fully charged at 12.8-13.0V (vs 12.6-12.8V for flooded), and higher charging voltages (14.6-14.8V vs 14.4-14.6V). Using flooded battery voltages for AGM leads to chronic undercharging. Gel batteries differ further, requiring even lower charge voltages to prevent damage.
How do I know if my battery charger is working properly?
Monitor voltage during charging: it should reach 14.4-14.8V during bulk phase, maintain 13.8-14.2V during absorption (2-4 hours), then drop to 13.2-13.4V for float. If voltage never exceeds 13.8V, the charger is underperforming. If it exceeds 15V, it’s dangerously overcharging. Use a multimeter to verify charger output independently.
What voltage is too low for a 12V flooded battery?
Never discharge below 12.1V (50% depth of discharge). Below 11.9V, sulfation accelerates rapidly. At 10.5V, consider the battery fully discharged – further discharge risks permanent damage. If a rested battery reads below 12.0V, immediately recharge using a proper multi-stage charger to attempt recovery.
Why does my battery voltage drop overnight when not in use?
Parasitic drain (0.05A is normal, >0.1A indicates problems) or internal self-discharge causes this. Flooded batteries self-discharge 4-8% monthly. Excessive drop suggests: dirty case causing surface leakage, faulty vehicle electronics, or internal short circuits. Test by fully charging, disconnecting, and monitoring voltage daily – >0.1V/day drop requires investigation.
How does temperature affect battery voltage readings?
Voltage decreases in cold and increases in heat, though actual charge remains unchanged. At 32°F (0°C), subtract 0.028V from readings; at 95°F (35°C), add 0.028V. More critically, cold reduces available power – a battery showing 12.6V at 0°F may not start an engine despite appearing charged. Always compensate readings for temperature accuracy.