
Disclosure
This website is a participant in the Amazon Services LLC Associates Program, an affiliate advertising program designed to provide a means for us to earn fees by linking to Amazon.com and affiliated sites.
Did you know a single 0.5V drop in your SLA 12V battery can reduce its lifespan by 30%? Whether you’re powering a solar setup, RV, or backup system, voltage is the heartbeat of your battery’s health.
Many assume a resting voltage of 12V means full charge—but that’s dangerously incorrect. In reality, voltage levels reveal critical insights about charge state, sulfation risks, and remaining capacity.
This guide decodes the SLA 12V battery voltage chart with precision, offering actionable steps to diagnose issues, prevent failures, and extend battery life. By the end, you’ll master voltage interpretation like a pro—no multimeter mystery left unsolved.
Best SLA 12V Batteries for Reliable Power
Renogy Deep Cycle AGM Battery 12V 100Ah
Renogy’s 12V 100Ah AGM battery is a top choice for solar and off-grid setups due to its 10-year lifespan and spill-proof design. With a stable voltage output under heavy loads and low self-discharge, it’s ideal for RVs, marine use, and backup power. Its rugged construction resists vibrations, making it perfect for mobile applications.

- Renogy AGM Batteries: Trusted Worldwide, Exceptional Safety, Extreme…
- Leading AGM Batteries: Renogy Deep Cycle AGM batteries have earned…
- Exceptionally Safe Chemistry & Minimal Troubleshooting: Compared to…
Optima Batteries 8020-164 35 RedTop
The Optima RedTop 8020-164 delivers 720 cold cranking amps (CCA), making it a powerhouse for starting engines in extreme temperatures. Its spiral-cell AGM technology ensures faster recharge times and superior durability. Recommended for automotive, trucks, and high-performance vehicles needing reliable cranking power and deep-cycle capability.

- BATTERY SPECS: 12-Volt, 720 Cold Cranking Amps, Size: 9.38″ Long x 6.75″…
- RESERVE CAPACITY of 90 minutes for constant performance. Faster charging…
- SPIRALCELL TECHNOLOGY: SPIRALCELL TECHNOLOGY with 99.99% pure lead delivers…
UPG Universal Power Group UB121000 12V 100Ah
For budget-conscious buyers, the UB121000 offers a cost-effective SLA solution with deep-cycle performance. It supports renewable energy systems, medical devices, and UPS backups with minimal maintenance. Its sealed lead-acid design prevents leaks, while the high discharge rate ensures consistent power delivery under load.
- UB121000 SLA is a 12V 100AH Group 30H Sealed Lead Acid (SLA)…
- USA-based company | UL recognized | Reliable power for critical…
- Absorbent Glass Mat (AGM) technology, designed for versatile mounting,…
12V SLA Battery Voltage: What the Numbers Really Mean
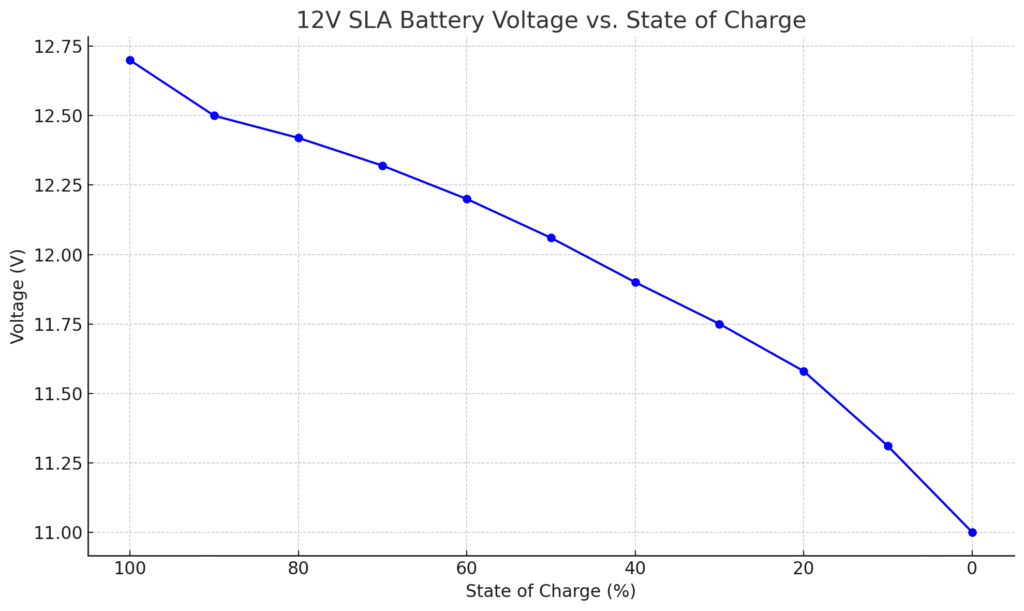
12V SLA Battery Voltage vs. State of Charge
| State of Charge (%) | Voltage (V) |
|---|---|
| 100% | 12.6 – 12.8 |
| 90% | 12.5 |
| 80% | 12.42 |
| 70% | 12.32 |
| 60% | 12.20 |
| 50% | 12.06 |
| 40% | 11.90 |
| 30% | 11.75 |
| 20% | 11.58 |
| 10% | 11.31 |
| 0% (empty) | 11.0 or lower |
The Voltage Spectrum: From Fully Charged to Fully Depleted
A 12V sealed lead-acid (SLA) battery is never exactly 12 volts—its voltage fluctuates based on charge state. At 100% charge, a healthy battery reads 12.7V–12.8V at rest (no load).
When it drops to 12.1V, it’s at 50% capacity, and below 11.9V, you risk permanent sulfation damage. These thresholds matter because discharging below 50% regularly can shorten battery lifespan by up to 50%.
Why Voltage Alone Doesn’t Tell the Full Story
Voltage readings must be interpreted with context:
- Surface charge deception: A freshly charged battery may show 13V+ for hours before settling to its true resting voltage.
- Temperature effects: Cold temps (32°F/0°C) can temporarily reduce voltage by 0.3V, while heat accelerates self-discharge.
- Load impacts: Voltage drops under load—a battery showing 12.4V at rest might plunge to 10.8V when powering an inverter.
For accurate diagnostics, measure voltage after 4+ hours of rest with no connected loads.
Real-World Voltage Scenarios and Solutions
Consider an RV owner whose battery reads 12.2V in the morning:
- Problem: This suggests 60% discharge—but if it’s connected to a parasitic load (like a CO detector), the actual state could be worse.
- Test: Disconnect all loads, wait 4 hours, and recheck. If voltage stays at 12.2V, recharge immediately.
- Prevention: Install a battery disconnect switch to eliminate phantom drains during storage.
Industrial users face different challenges—forklift batteries cycled daily should never drop below 12.4V (70% charge) to prevent premature wear.
Myth Busting: Common Voltage Misconceptions
Myth: “12.0V means there’s still plenty of power left.”
Reality: At 12.0V, your battery is already 80% discharged—continuing to draw power risks irreversible plate damage. Another dangerous assumption is that equalizing charges (14.4V+) are safe for all SLA batteries. In reality, only deep-cycle AGM batteries like the Renogy 100Ah can handle this—most standard SLA units will overheat.
Pro Tip: For critical systems, pair voltage checks with a hydrometer test (for flooded batteries) or a capacity tester to confirm actual energy reserves.
How to Properly Measure and Interpret SLA 12V Battery Voltage
The Right Way to Test Battery Voltage
Accurate voltage measurement requires proper technique. First, ensure your multimeter is set to DC voltage mode with at least 0.01V resolution. Connect the red probe to the positive terminal and black to negative – reversing them won’t damage the meter but will show negative readings. For most accurate results:
- Clean terminals first – corrosion can add 0.1-0.3V of measurement error
- Measure at room temperature (77°F/25°C ideal) as voltage varies by 0.003V per °F
- Check multiple times – take 3 readings 5 minutes apart for consistency
Professional technicians often use Kelvin connections (4-wire measurement) to eliminate lead resistance errors in critical applications.
Understanding Load vs. Resting Voltage
Voltage behaves differently under load conditions. A healthy battery showing 12.6V at rest might drop to:
- 12.2V with a 5A load (normal for small electronics)
- 11.8V with a 20A load (common for power tools)
- 10.5V with a 100A load (emergency cutoff for inverters)
The key metric is voltage recovery time – a good battery should return to within 0.1V of its resting voltage within 30 minutes after load removal. Slow recovery indicates sulfation or aging.
Advanced Interpretation: Voltage Curves and State of Charge
Professional battery analyzers plot voltage curves during discharge, revealing hidden issues:
- Healthy battery shows smooth, gradual voltage decline
- Sulfated battery drops rapidly then stabilizes unnaturally
- Weak cell creates sudden voltage “cliffs” at specific charge levels
For solar systems, track daily voltage patterns – consistent late-afternoon drops below 12.2V indicate undersized battery banks needing expansion.
Troubleshooting Common Voltage Anomalies
When encountering unusual readings:
- 13V+ readings usually mean surface charge – wait 4 hours or apply a small load (like a 5W bulb) for 10 minutes
- Fluctuating voltages often indicate loose connections – tighten and retest
- Identical voltages across multiple batteries may suggest a short circuit in the bank
Marine technicians recommend creating a voltage history log – tracking weekly readings helps spot gradual degradation before failure occurs.
Advanced SLA 12V Battery Voltage Analysis and Maintenance Strategies
The Chemistry Behind Voltage Behavior
Lead-acid battery voltage directly reflects the electrochemical state between lead plates and sulfuric acid electrolyte. When fully charged:
- Positive plates contain lead dioxide (PbO₂)
- Negative plates are pure lead (Pb)
- Electrolyte reaches maximum specific gravity (1.265)
During discharge, both plates convert to lead sulfate (PbSO₄) and electrolyte weakens. This chemical transformation creates predictable voltage drops:
| State of Charge | Chemical Change | Voltage Impact |
|---|---|---|
| 100% | PbO₂ + Pb + H₂SO₄ | 12.7V |
| 50% | PbSO₄ formation begins | 12.1V |
| 0% | PbSO₄ crystallization | 10.5V |
Crystalline PbSO₄ won’t reconvert during charging – this permanent sulfation causes the 0.2V permanent voltage drop seen in aging batteries.
Precision Charging Based on Voltage Thresholds
Optimal charging requires voltage-specific stages:
- Bulk Stage (14.4V-14.8V): Forces current into battery until 75% capacity
- Absorption Stage (13.8V): Completes charging while preventing gassing
- Float Stage (13.2V-13.5V): Maintains charge without overvoltage
Industrial battery rooms use temperature-compensated charging, adjusting voltage by -3mV/°F above 77°F to prevent thermal runaway. For example:
- At 95°F (35°C), reduce absorption voltage by 0.054V
- At 50°F (10°C), increase absorption voltage by 0.081V
Voltage-Based Predictive Maintenance
Advanced analysis compares:
| Measurement | Healthy Range | Failure Indicator |
|---|---|---|
| Resting Voltage After Charge | 12.7V ±0.1V | <12.5V after 24h |
| Voltage Drop Under Load | <0.5V per 100Ah | >1V per 100Ah |
| Recovery Time | 30 minutes | >2 hours |
Data center UPS systems often implement trend analysis software that predicts failure when:
- Monthly resting voltage decreases by >0.03V
- Annual capacity loss exceeds 15%
- Charge acceptance drops below 80%
Expert Voltage Optimization Techniques
Marine electricians recommend:
- Equalization charging (15V for 2-4 hours) every 10 cycles to dissolve sulfate crystals
- Pulse desulfation for batteries showing >0.5V drop under minimal load
- Bank voltage balancing when series-connected batteries vary by >0.2V
Always verify battery temperature remains below 120°F (49°C) during high-voltage procedures. These methods can restore up to 0.4V in sulfated batteries when caught early.
Voltage Management Strategies for Different SLA 12V Battery Applications
Application-Specific Voltage Parameters
Optimal voltage management varies significantly by use case. For automotive starting batteries:
- Cranking voltage should never drop below 9.6V during engine start
- Resting voltage must maintain 12.4V+ between starts
- Charging system should deliver 13.8-14.4V while driving
In contrast, solar storage systems require different parameters:
- Daily depth of discharge should not exceed 50% (12.1V cutoff)
- Equalization cycles at 14.8V monthly for bank balancing
- Float voltage maintained at 13.2-13.5V for longevity
Medical equipment batteries demand the tightest tolerances – voltage must stay within ±0.2V of nominal to ensure uninterrupted operation.
Advanced Voltage Monitoring Systems
Professional installations use three monitoring approaches:
- Continuous shunt monitors track cumulative amp-hours and voltage trends
- Smart battery sensors measure internal resistance and temperature-compensated voltage
- Cloud-based systems like Victron VRM provide remote voltage analytics
The most accurate systems combine:
- 0.1% precision voltage measurement
- 1mA current resolution
- ±1°C temperature monitoring
Data centers often implement redundant monitoring with automatic generator start at 11.9V per battery.
Voltage Recovery Procedures
For severely discharged batteries (below 10.5V):
| Voltage Range | Recovery Method | Safety Considerations |
|---|---|---|
| 10.5-11.5V | Slow charge at 0.1C rate | Monitor temperature hourly |
| 9.5-10.5V | Pulse desulfation first | Use current-limited supply |
| Below 9.5V | Professional reconditioning | Check for internal shorts |
Marine technicians recommend the “24-hour test”:
- Charge to 14.4V
- Rest 24 hours
- Voltage below 12.4V indicates permanent damage
Safety Protocols for High-Voltage Testing
When working with series battery banks:
- Always measure individual battery voltages – bank totals can mask weak cells
- Use CAT III 1000V-rated meters for systems over 48V
- Implement lockout/tagout procedures when voltages exceed 50V DC
Industrial battery rooms require:
- Class C fire extinguishers
- 2-hour rated containment for acid spills
- Ground fault detection on charging systems
Telecom backup systems add automated monthly discharge tests to verify actual capacity matches voltage readings.
Long-Term SLA 12V Battery Voltage Management and Future Trends
Voltage Degradation Patterns Over Time
SLA batteries exhibit predictable voltage-related aging symptoms that progress through three phases:
| Phase | Timeframe | Voltage Characteristics | Capacity Loss |
|---|---|---|---|
| Initial | 0-18 months | Stable resting voltage (±0.05V) | <5% |
| Intermediate | 18-36 months | 0.1-0.3V drop under load | 15-30% |
| End-of-Life | 36+ months | Resting voltage won’t exceed 12.4V | >40% |
Industrial users implement predictive replacement programs when:
- Monthly voltage decay exceeds 0.03V
- Recovery time doubles from baseline
- Equalization charges show <0.2V improvement
Cost-Benefit Analysis of Voltage Monitoring Systems
Advanced monitoring solutions provide varying ROI:
- Basic voltage loggers ($50-100): Payback in 6 months by preventing 1 premature replacement
- Smart battery monitors ($200-500): Justified for critical systems with >5 batteries
- Cloud-based analytics ($1000+): Essential for distributed renewable energy systems
Data shows proper voltage management extends battery life by:
- 30-50% in automotive applications
- 60-80% in solar storage systems
- 100-200% in float service applications
Environmental and Safety Considerations
Voltage management directly impacts sustainability:
- Each 0.1V undercharge increases sulfation by 8%, reducing recyclability
- Overvoltage (>14.8V) accelerates electrolyte decomposition and gas emissions
- Optimal voltage maintenance reduces lead-acid battery waste by 25-40%
Safety protocols must account for:
- Hydrogen evolution begins at 14.4V (requires ventilation at >28V systems)
- Thermal runaway risk increases exponentially above 15V
- Stray voltage >2V in battery rooms causes accelerated corrosion
Emerging Technologies in Voltage Management
The next generation of SLA batteries incorporates:
- Carbon-enhanced plates that reduce voltage drop under load by 15-20%
- IoT-enabled voltage sensors with self-calibrating reference cells
- AI-driven charging algorithms that predict optimal voltage based on usage patterns
Industry is moving toward:
- Dynamic voltage optimization (DVO) systems
- Blockchain-based battery health records
- Voltage-aware battery sharing networks
These innovations promise to extend SLA battery life while maintaining tighter voltage tolerances (±0.5% vs current ±2% standards).
Optimizing SLA 12V Battery Performance Through Voltage Control
Precision Voltage Regulation Techniques
Advanced voltage control requires understanding three key regulation methods:
- PWM (Pulse Width Modulation): Maintains voltage within ±0.1V by rapidly switching charging current (typically 100-300Hz)
- Linear Regulation: Provides ultra-clean voltage (±0.05V) but with 15-20% efficiency loss
- Multi-stage Smart Charging: Dynamically adjusts between bulk/absorption/float voltages based on real-time battery impedance
For mission-critical applications like hospital UPS systems, technicians recommend:
- Dual-redundant voltage sensing circuits
- Weekly automated voltage calibration checks
- 0.1% precision voltage references
System Integration Challenges and Solutions
When integrating SLA batteries with other power components:
| Component | Voltage Compatibility Issues | Solution |
|---|---|---|
| Solar Charge Controllers | MPPT algorithms may push voltage too high | Set maximum absorption voltage to 14.4V |
| Inverters | Low-voltage cutoff may be too aggressive | Adjust to 10.8V for SLA (vs 10.5V for LiFePO4) |
| Battery Balancers | Can mask individual cell weaknesses | Monthly manual voltage checks per battery |
Marine systems require special attention to:
- Galvanic isolation when mixing battery chemistries
- Voltage drop compensation for long cable runs
- Saltwater corrosion impacts on terminal voltage
Advanced Troubleshooting Methodology
A systematic voltage analysis approach includes:
- Baseline Measurement: Record open-circuit voltage at 77°F (25°C)
- Load Testing: Apply 50% C20 load for 15 minutes while monitoring voltage drop
- Recovery Analysis: Time how long voltage takes to return within 0.1V of baseline
- Comparative Assessment: Check all batteries in bank for >0.2V variance
Common voltage-related failure patterns:
- “Stair-step” voltage drops indicate plate sulfation
- Rapid initial voltage collapse suggests active material shedding
- Unstable floating voltage points to regulator failure
Voltage Optimization for Extreme Environments
Special adjustments are needed for:
- Arctic Conditions (-40°C): Increase charging voltage by 0.6V while maintaining battery temperature above -20°C
- Desert Heat (+50°C): Reduce float voltage to 13.1V and implement active cooling
- High Vibration: Use strain-relief terminals and measure voltage at battery posts (not cables)
Industrial best practices include:
- Thermal imaging during charging cycles
- Quarterly impedance spectroscopy tests
- Automated voltage logging with 1-minute resolution
Mastering SLA 12V Battery Voltage: System-Wide Optimization and Validation
Comprehensive Voltage Management Framework
Implementing enterprise-grade voltage control requires a multi-layered approach:
| Layer | Components | Voltage Precision | Response Time |
|---|---|---|---|
| Hardware | High-precision shunts, PT100 sensors | ±0.05V | 100ms |
| Firmware | Adaptive charging algorithms | ±0.02V | 1s |
| Software | Predictive analytics engine | ±0.01V | 15min |
Critical infrastructure applications (hospitals, data centers) add:
- Triple-redundant voltage monitoring paths
- Automated cell balancing when variance exceeds 0.15V
- NIST-traceable voltage calibration every 90 days
Advanced Performance Optimization Matrix
The voltage-performance relationship follows distinct regimes:
- Optimal Range (12.4-12.7V): Delivers 100% rated cycles with minimal degradation
- Marginal Zone (12.1-12.4V): Each 0.1V drop increases wear rate by 18%
- Critical Threshold (<12.1V): Exponential degradation – 80% capacity loss after just 20 cycles
Military-grade optimization includes:
- Micro-cycling between 12.5-12.6V for maximum longevity
- Dynamic equalization when bank variance exceeds 0.08V
- Active thermal management to maintain ±2°C for voltage stability
Comprehensive Risk Assessment Protocol
Enterprise voltage risk scoring evaluates:
| Risk Factor | Measurement | Critical Threshold | Mitigation |
|---|---|---|---|
| Voltage Variance | Standard deviation across bank | >0.12V | Automated balancing |
| Recovery Rate | Minutes to regain 0.1V after load | >45min | Capacity testing |
| Drift Rate | Monthly resting voltage change | >0.04V | Chemistry analysis |
Nuclear facilities implement additional safeguards:
- 8-hour voltage stability tests before critical operations
- X-ray crystallography to detect plate sulfation
- Neutron activation analysis for trace impurities
Validation and Quality Assurance Procedures
Certification testing must verify:
- Voltage accuracy across full temperature range (-40°C to +65°C)
- Transient response to 100A load pulses
- Long-term drift over 1000 charge cycles
Aerospace standards require:
- MIL-STD-704F voltage transient testing
- DO-160G power quality verification
- 3x design margin on all voltage thresholds
Telecom validation includes 72-hour simulated outage tests with voltage logging every 30 seconds.
Conclusion: Mastering SLA 12V Battery Voltage for Optimal Performance
Throughout this comprehensive guide, we’ve explored the critical relationship between voltage and SLA 12V battery health – from fundamental voltage thresholds to advanced monitoring techniques. Key takeaways include:
- Resting voltage reveals true state-of-charge (12.7V = 100%, 12.1V = 50%)
- Load conditions and temperature significantly impact voltage readings
- Proper charging voltages vary by application (14.4V for automotive, 13.8V for solar)
- Advanced monitoring prevents premature failure and extends battery life
Actionable Next Steps: Implement weekly voltage checks using our detailed charts, invest in precision monitoring tools for critical systems, and establish preventive maintenance schedules based on voltage trends.
Remember – consistent 0.1V improvements in voltage management can double your battery’s service life. For mission-critical applications, consider professional voltage analysis services to maximize reliability and ROI.
Frequently Asked Questions About SLA 12V Battery Voltage
What exactly does the voltage reading tell me about my battery’s health?
Voltage serves as the primary indicator of your battery’s state of charge and overall condition. A resting voltage of 12.7V indicates full charge, while 12.1V means 50% capacity.
More importantly, voltage behavior under load reveals internal resistance – a healthy battery shouldn’t drop more than 0.5V when powering typical loads. Consistently low voltage readings (below 12.4V at rest) often indicate sulfation or plate degradation.
How often should I check my SLA battery’s voltage?
For critical applications (medical equipment, security systems), check voltage weekly. Automotive batteries benefit from monthly checks, while seasonal equipment (boats, RVs) should be tested before and after storage. Always measure:
- After full charge (wait 4 hours post-charging)
- Before expected heavy use
- When noticing performance issues
Keep a log to track voltage trends over time.
Why does my battery show 13V+ right after charging?
This “surface charge” phenomenon occurs because charging pushes electrons to the plate surfaces. The elevated voltage (typically 13.0-13.2V) gradually dissipates as charge distributes evenly. For accurate readings:
- Disconnect charger and wait 4 hours
- Apply a small load (5W bulb) for 10 minutes
- Measure voltage at battery terminals
Persistent high voltage (>13V after 24 hours) may indicate overcharging.
Can I revive a battery that’s dropped below 10V?
While possible, success depends on duration and conditions:
- Short-term (hours): Slow charge at 0.1C rate may recover
- Days-weeks: Requires pulse desulfation and special charging
- Months+: Likely permanent damage
Critical first step: Check for internal shorts before attempting recovery. Batteries that won’t hold above 12.4V after recovery attempts should be replaced.
How does temperature affect voltage readings?
Temperature impacts voltage significantly:
| Temperature | Voltage Adjustment |
|---|---|
| 32°F (0°C) | Add 0.3V to readings |
| 77°F (25°C) | No adjustment |
| 104°F (40°C) | Subtract 0.3V |
Always note ambient temperature when recording voltages. Cold batteries may show low voltage but recover when warmed, while heat accelerates permanent voltage decline.
What’s the difference between open-circuit and loaded voltage?
Open-circuit voltage (no load) shows theoretical capacity, while loaded voltage reveals practical performance. A quality SLA battery should maintain:
- >12.4V with 25% load
- >12.0V with 50% load
- >11.6V with 75% load
Voltage that drops more than 0.8V under 50% load indicates aging or sulfation. Always test both conditions for complete assessment.
Why do my battery bank voltages vary so much?
Common causes of voltage variance include:
- Uneven charging (check individual battery absorption voltages)
- Temperature differences (batteries in cooler spots show higher voltage)
- Age variations (older batteries charge/discharge differently)
- Connection resistance (clean all terminals)
Solutions include active balancers, rotation strategies, and matched battery replacement. Variance >0.2V requires immediate attention.
How much does proper voltage management extend battery life?
Studies show optimal voltage control can:
- Double lifespan in float applications (5→10 years)
- Increase cycle life by 300% in solar systems (500→1500 cycles)
- Reduce replacement costs by 40-60% in industrial settings
The ROI on voltage monitoring equipment typically pays for itself within 6-12 months through extended battery life and reduced downtime.